This is the second Web page for Mathcad Tutorial. If you have not studied the first one,
Click Here, otherwise proceed to create 3-D graphs as
explained below.
Step 4: If you do not see the Graph
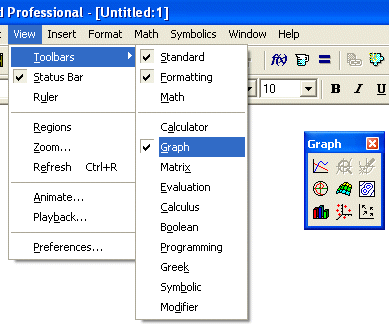
toolbar on your Mathcad screen, click on View and from the drop-down
menu, select Toolbars, and then Graph. The Graph
toolbar will be placed on the your screen.
At the bottom of the Graph Tutorial on the Mathcad Resource Center you can see
a link to
3D Graphing which would provide you with an
excellent overview of 3D graphs.
Step 5 - Method#1: If you do not see the Graph
toolbar on your Mathcad screen, click on View and from the Here is an easy way to
start. Let's start with a 3-D function of
F(x,y) = 2 x2 y + 12 x y2 - 5 y3 + 4.
First enter the function F(x,y) : 2 x^2 y + 12 x y^2 -
5 y^3 + 4 Which will be shown as F(x,y)
:= 2 x2 y + 12 x y2 - 5 y3 + 4
on the screen. Press enter and then click on the Surface Plot icon
 on the graph toolbar.
A graph coordinate system appears. On the placeholder at the bottom-left
corner type the name of the function, in this case F.
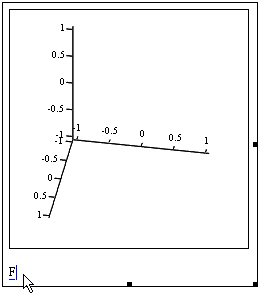
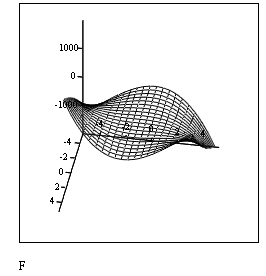
The 3-D graph will be displayed. It uses the default settings. You
can rotate the graph by clicking inside the plot area and moving the mouse while
holding the left mouse button down.
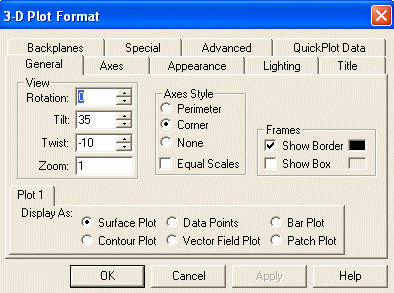
Double-click on the graph. 3-D Plot Format widow will open that would
allow you to format the graph display based on your desired specifications.
Below is a sample of few changes that I have made to the above graph.
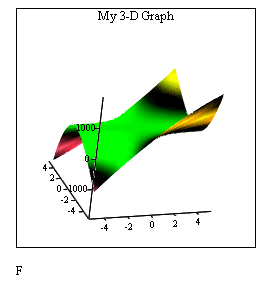
Step 6 - Method#2: In the above method,
Mathcad used a function called CreateMesh internally. In here, we
are going to used it explicitly. Your basic steps are:
- Define the function
- Define the lower and upper values for the variables
- Use CreateMesh to generate matrix of values for the function
- Plot and format the function as done in Method#1.
Again, let's start with the same function in Step 6,
G(x,y) = - 4 x3 y + 8 x y2 + 3 y4 - 7.
First enter the function G(x,y)
: -4 x^3 y + 8 x y^2 + 3 y^4 - 7 which will be shown as
G(x,y)
:= - 4 x3 y + 8 x y2 + 3 y4 - 7
on the screen. Then define upper and lower values for x and y
as follows:
x0:=-4
x1:=4
y0:=-4
y1:=4
Now use the CreateMesh function :
CreateMesh(G,x0,x1,y0,y1) and finally, click on Surface Plot
icon
 on the graph toolbar. Enter G on the function name placeholder and
press ENTER.
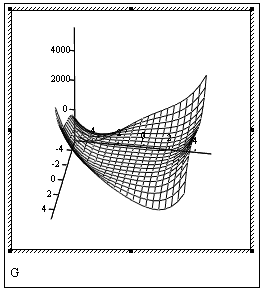
Again right-click anywhere inside the plot area (or double-click)
and from the widow that opens choose Format and make changes to the graph
as you desire.
Below is a sample of few changes that I have made to the above graph.
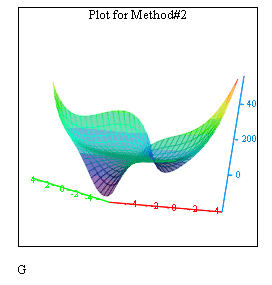
This one is the contour representation of the same graph.
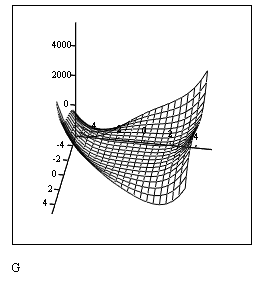
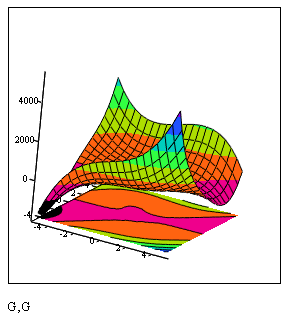
And this one both graphs combined. Notice how I have used G,G to create the two plots together.
I have then used the Format window to represent one as the Surface Plot and the Other as Contour Plot.
To further explore the
capabilities of Mathcad, use its Help menu.
Additional tutorials related
to our topics may be available in the future.
|


